WinTally Software Manual
Last Updated 04/22/2015
Table of Contents
2.1 Connecting to the MicroTally.
2.1.1 The Communications Status Bar.
2.1.2 The “Preferences” button.
2.1.3 The “Open Data File” button.
2.1.5 The “Scan for unit…” button.
2.1.7 The “Download Data” button.
2.1.8 The “Reset Unit” button.
2.1.9 The “Edit Unit ID” button.
2.1.10 The “Change Timeout” button.
2.3.2 Multiple Study Downloads.
3.3 MicroTally button “data type”.
3.4 Video Counting with the MicroTally.
4.0 When Things Don't go Right.
4.1 I did a single study, but it got split into two studies.
4.2 I get a “backwards timestamp” error when downloading my data.
4.3 My MicroTally won’t connect to WinTally.
4.4 Data does not seem to be correct.
4.5 The MicroTally is beeping Rapidly when in the “Run” position.
The VehicleCounts.com WinTally software is the key to the MicroTally unit's features. With WinTally, you can configure the MicroTally data into your desired studies and reports. The MicroTally unit simply stores raw time-stamps of button presses, it is up to the WinTally software to analyze the data and separate it into the proper bins, studies, and intervals.
This manual will describe in detail how the WinTally software works with the MicroTally counters to deliver the desired study results.
Intersection. A point where two or more roads meet or cross.
PC. Short for “Personal Computer” which in this document also means any computer having at least one USB port and running Windows software; desktop, laptop, tablet, or smart phone.
Roadway. The active surface of the highway, road, street, or driveway that vehicles travel on.
Serial Port. A communications connection on your PC that allows you to communicate with the MicroTally. On Windows® based computers these are usually referred to as COM1, COM2, COM15, etc.
Study. A term used in the industry to specify a contiguous (no breaks) counting session.
Tally. Means sum, or total.
Turning Movement. A term used to indicate the exit direction of a vehicle that has entered an intersection (turning left, right, or going straight) at an intersection.
USB to Serial Converter. Most newer computers do not have built-in serial ports, therefore if you need a serial port, you must use a USB to Serial converter device.
Vehicle Classification. The type of motorized vehicle, such as car, delivery truck, bus, etc. Most common classification scheme used in the USA is the FHWA 13 class scheme.
The following trademarks are used throughout this manual:
Windows® is a registered trademark of Microsoft Corporation.
MicroTally is a trademark of R&R Technologies, Inc.
WinTally is a trademark of R&R Technologies, Inc.
VehicleCounts.com is a trademark of R&R Technologies, Inc.
This section discusses the operation of the Wintally software, including establishing communications with the MicroTally, configuring the MicroTally, downloading the MicroTally data, resetting the MicroTally unit (clearing data), processing the MicroTally data, and generating reports, or exports, of the data.
There are two models of the MicroTally counter, the MicroTally 14 and the MicroTally 18. They are identical except for the addition of 4 extra tally keys on the MicroTally 18. The software descriptions that follow will use the term MicroTally to refer to either model except where there is a difference (like in key definitions).
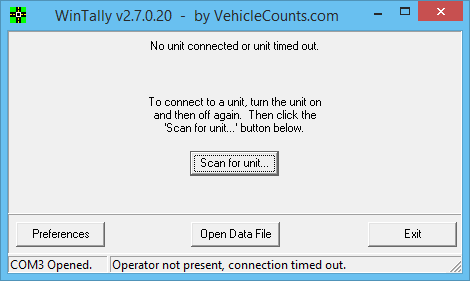
We will start with a description of the opening screen for WinTally. The above screen is what you would normally see when a MicroTally unit is connected. The below screen you will see if there is no MicroTally connected when starting the software, or if it times out (to conserve power on the MicroTally units the WinTally will cease communication after 5 minutes of no activity).
We will start with a description of the “not connected” screen.
At the very bottom of the screen is a communications status bar. The left side of the bar shows which (if any) serial port the WinTally software is connected to. On the middle and right side is the actual status of the communications. In the example above, COM3 is opened, but WinTally is not communicating because it timed out. If you started WinTally with no MicroTally attached, no COM port would show on the left and the middle right message would be “Com ports scanned, no unit connected.”
This button opens the preferences dialog:
This screen would only rarely be accessed. The first time you set the software up -- to enter the Organization Name and maybe your data directory. At later times as you become more familiar with the software and wish to set up your own default button configurations. If you do not understand the setting, don’t change it, leave it alone. The factory default settings will work for most applications. This screen will be discussed in the appropriate sections below.
This button will open a Windows “Open” dialog which will allow you to select a previously saved data file. After downloading your MicroTally data, it is wise (also recommended) to save a copy of the raw data, even if you are only going to be generating a report. You never know what might go wrong. Once the raw data file has been saved. At any time you can open the file with this button, it is similar to downloading the data from the MicroTally. More on this in sections below.
This button closes the WinTally software.
Once a MicroTally is attached to the PC you would press this button to start communications. When pressed, the WinTaly software scans all available serial ports on your PC (including USB to serial ones) looking for a MicroTally unit. When it is found and attached, the “connected” screen shows as in the example below.
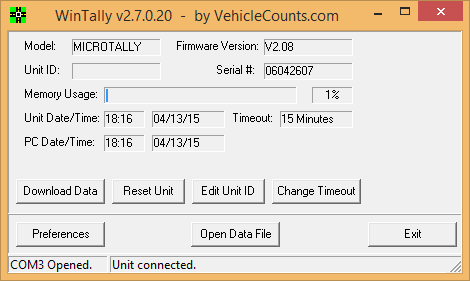
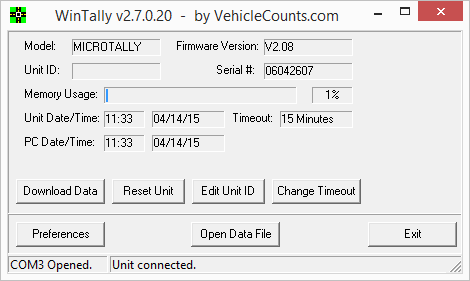
The “connected” screen has four additional buttons and several information fields as shown here:
There are several information fields that show up when a MicroTally unit connects to the WinTally software. This information lets you know what general status the MicroTally unit is in.
Model: This field show the type of MicroTally unit that is connected. “MICROTALLY” is a MicroTally 14, and “MICROTALLY 18” is a MicroTally 18.
Firmware Version: This field shows the version of software in the MicroTally unit. This information can be useful when troubleshooting problems with a unit.
Unit ID: This is a user field and can be anything the user wants. See “Edit Unit ID” button description below.
Serial#: All MicroTally units are given a serial number when built. This allows us to track a units repair history and to determine if a repair is under warranty or not. This number should also be present on the back side of the MicroTally case.
Memory Usage: This field is a bar graph that graphically shows about how much data memory has been used. To the right is another field that shows digitally the percentage used.
Unit Date/Time: These two fields show the current date and time in the units real time clock. These should be identical (or nearly so) with the PC Date/Time. If they are not, you may have a problem when processing the data. The biggest cause of difference is when going between daylight savings time and standard time, or traveling across time zones. Minor differences can show up if the unit has not been reset for some time.
Timeout: This field shows the automatic stop timeout in the MicroTally unit. The factory default is 4 minutes. See the Change Timeout button description below.
PC Date/Time: These two fields show the current date and time of the PC when you first connect to a MicroTally unit. It should normally be the same as the MicroTally date and time.
This button, when pressed, will download the data from the MicroTally into the WinTally software. For details, see the Downloading Data section below.
This button resets (clears, zeros) the MicroTally data memory as well as synchronizes the MicroTally real time clock to the PC clock. This should be done every time before a new series of studies is started to insure the clocks are properly synchronized.
This button allows the user to edit the unit ID field. When the edit is complete by clicking on the Save button the edited data will be stored in the MicroTally unit. Click on the Cancel button if you do not want to make any changes to the field.
This button allows you to change the Automatic Stop Timeout in the MicroTally unit. To conserve power, the MicroTally unit will automatically put itself in the “Stop” mode after several minutes of no keypad activity. Therefore, if you start a study by moving the “Run/Stop” switch to the “Run” position, but forget to switch it to “Stop” at the end of the study, the unit will automatically stop the study after a timeout. The factory default is 4 minutes. however, depending on how your studies are conducted, this may be too short, so this button allows you to change that. In this particular MicroTally (see screen show above) the timeout is set to 15 minutes. If the automatic timeout is executed, the MicroTally unit will “chirp” once each 30 seconds and the buttons will become non-responsive.
The very first time you connect to a MicroTally unit you will want to go into the “Preferences” and change/enter the following:
Organization Name: This will show up on all generated reports and exports, so you most likely want your company name here.
Data Directory: Here you type in or choose (by clicking on the “Browse” button, a path to where your data files are to be stored
Generally you will have a common button setup which works best for how you use the units. If you know how you plan to use buttons on all or most units, you will probably want to also click on "Edit Button Configurations".
Here you can set the names for all the buttons along with how you want to use the button (the types mentioned above: Tally, Undo Last Tally, Shift, or Shift Lock.) This will be used by default from now on when you download data from a MicroTally unit. You can still change it when you download, this will just save you some time so you don't always have to edit that information for each unit. Editing this screen will be discussed in more detail below.
The other settings are more advanced and will be discussed later in this document, so close the preferences screen.
You may wish to give this MicroTally a unique name. You do this by clicking on the “Edit Unit ID” button. This unit identification information will show up on all reports and exports.
Next you may want to change the default Automatic Stop Timeout from the factory default of 4 minutes. You do this by clicking on the “Change Timeout” button.
Now click on the “Reset Unit” button and you are now ready for your first study.
Once your study has been completed, you may download the data from the MicroTally into WinTally.
You do this by clicking on the “Download Data” button.
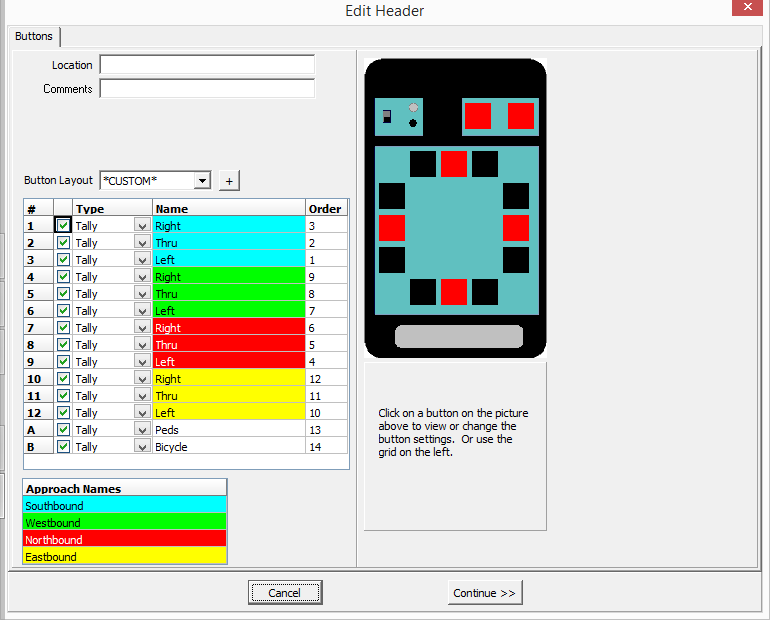
If you only have one study in the MicroTally unit, then the edit header window will pop up.
Here you can enter the Location and Comments data for this study, choose a Button Layout from the pull-down menu. Note! The button layout presented is the one set in the Preferences window. You can also edit any or all of the button assignments at this time if you wish. When you are ready to proceed, click on “Continue>>”.
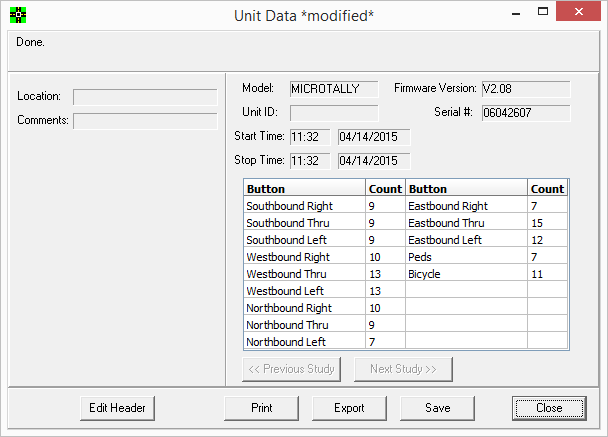
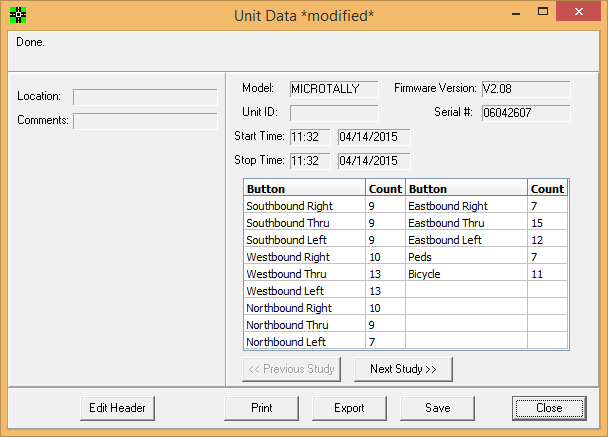
You will now see the Unit Data summary screen:
This is a general overview window for you to quickly glance at a study and make sure everything looks ok. From this window you will be able to edit the header (location/comments/buttons), print reports, export the data, or save it. In the case of a multi-study download you will also be able to select the study you would like to print or export by using the "Previous Study" / "Next Study" buttons.
The fields in this screen are described here:
Location: This shows the location that was entered for this study.
Comments: This shows any comments for this study.
Model: The type of unit that the data was downloaded from is listed here. Currently we have two models, the MicroTally 14 which is listed as: "MICROTALLY", and the MicroTally 18, which is listed as “MICROTALLY 18”.
Firmware Version: This is the firmware version of the unit at the time the data was downloaded.
Unit ID: The Unit ID that was in the unit when the data was downloaded. This value is assigned by clicking on "Edit Unit ID" after connecting a unit. If used, it is often just to give a custom number to the unit (i.e. "Unit #11").
Serial #: This is the serial number of the unit that the data was downloaded from. This cannot be changed; it is assigned at the factory when the unit is assembled.
Start Time: This is the time and date when the study started. (When the switch on the unit was moved to the "Run" position).
Stop Time: This is the time and date when the study stopped. (When the switch on the unit was moved to the "Stop" position -- or in the case of the unit timing out this is the time of the last button pressed before the timeout).
The Data Table consists of two types of columns:
Buttons: These columns show the name of the button (preceded by it's approach name) for the count that will be in the column to the right.
Counts: These columns show the total number of button presses for the button name that's to the column to the left. Note: This is just a simple total of how many times a button was pressed, the data has not yet been processed to show shifted buttons and such.
There are a series of buttons across the bottom of the window:
Edit Header: Clicking on this button will let you edit button names, locations, and comments. For data with just a single study clicking this will take you to the "Edit Header window", for data with multiple studies it will take you to the "Edit Headers window".
Print: Clicking this button will take you to the print "Data Selection window" where you can select the button columns to print and various other report settings.
Export: Clicking this button will take you to the export "Data Selection window" where you can select the button columns to export and various other export settings.
Save: For single study data you will get the standard "Save As..." dialog where you are prompted for a folder to save to and a filename. For multi-study data you will see a multi-study "Save As... window" where you can give each study it's own filename. All files saved are in a special WinTally Data format (".wtd") which WinTally can open.
Close: This will close the data file and return you to the "Main window". Note! If you have not saved the data file, you will be prompted to when you attempt to close the window.
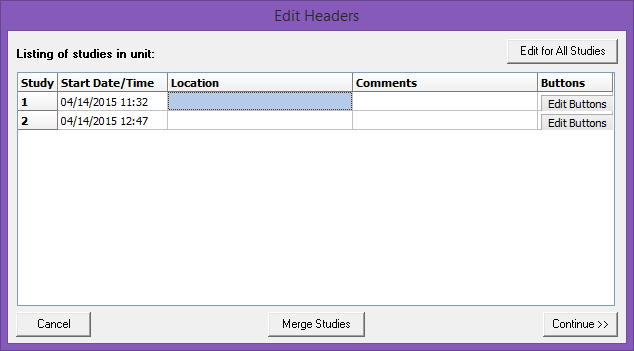
If have multiple studies in the MicroTally unit, then the “Edit Headers” window will pop up.
This screen is organized as a table of studies. In this screen you can edit the headers for each study. You can enter the Location and Comments directly into the table, and click on the individual “Edit Buttons” button to edit each button configuration individually.
If all the studies used the same header information, you can use the “Edit for All Studies” button to edit them all at once.
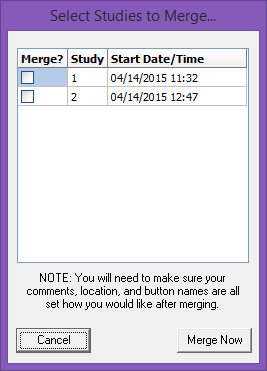
The other thing you can do is to merge studies. Sometimes the person collecting the data may switch the “Run/Stop” switch prematurely to the “Stop” position, then back to the “Run” position. Sometimes, the Automatic Stop Timeout gets executed in very slow traffic situations. In any case, this can be corrected by clicking on the “Merge Studies” button.
A table of all studies will pop up. You can click the “Merge?” checkbox on all studies you want merged together, then click on the “Merge Now” button. if you got to this screen accidently or because you were curious, you can click on “Cancel” to return without merging.
When you are ready to proceed, click on “Continue>>”.
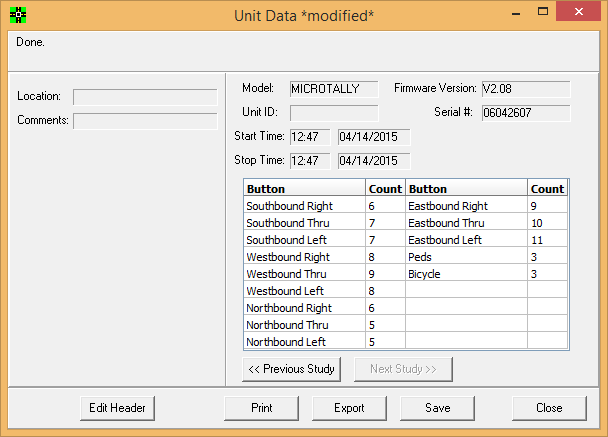
You will now see the Data Summary screen:
This is a general overview window for you to quickly glance at a study and make sure everything looks ok. From this window you will be able to edit the header (location/comments/buttons), print reports, export the data, or save it. In the case of a multi-study download you will also be able to select the study you would like to print or export by using the "Previous Study" / "Next Study" buttons. In multi-study downloads the “Print” and “Export” buttons are specific for the study currently shown on the screen.
Note that since this is a multi-study download the “Next Study>>” button is now active. You can now generate reports or export the first study. Clicking on the “Next Study>>” button will now take you to the second study.
While here you can now generate reports or exports for the second study. Note that the “<<Previous Study” button is now active, which will take you back to study 1. If there were more than 2 studies, then both the “<<Previous Study” and “Next Study>>” buttons will be active when on a middle study.
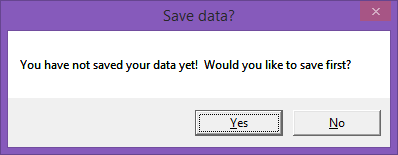
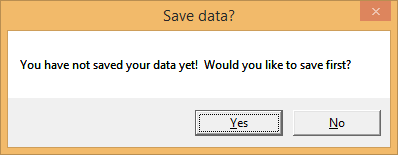
If you are done and click on “Close” without saving the data, you will be prompted to save the data:
When you are in the “Unit Data” screen you can generate a report by clicking on the “Print” button.
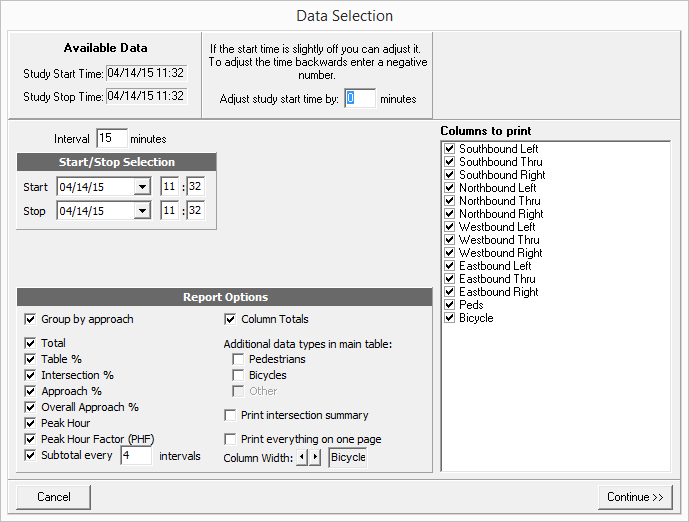
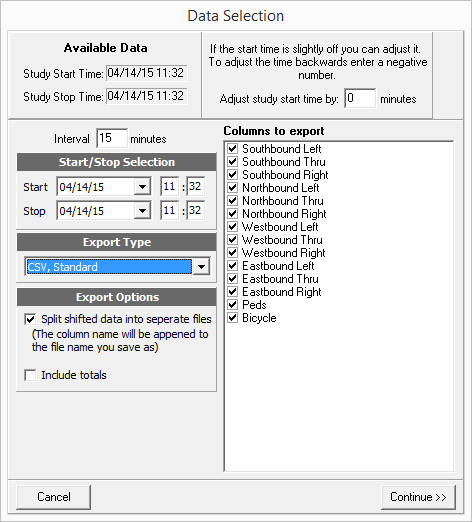
This will open a “Data Selection” screen:
This window is where you will choose what you want on your report. Here you can specify what columns you would like printed, you can adjust the start time, specify the length of each interval, choose which types of totals and statistics you want, and various other settings. This screen is formidable, so until you are comfortable with its settings (have generated a few reports), the default settings are a good start.
The upper left of this window shows the date/time range of the Available Data in this study. Normally you would expect it to be the same as or slightly wider than the actual study period.
The settings:
Adjust study start time by: You can adjust the start time forward or backward by entering a positive or negative number of minutes in this field. This allows for a slight adjustment to the start time. So if your watch doesn't agree with the unit's clock (which is the same as the PC's time that reset the unit) and you started a study at 3:04pm instead of at 3:00 you could enter a "-4" here to make the reports come out starting at 3:00 instead of 3:04.
Interval: This is how often (in minutes) buttons are summed up and displayed on the report as it's own row. For example, if the interval is 15, every 15 minutes there will be a button count listed on the report for each column. The default is 15 minutes. If you would like peak hour data, 60 minutes will need to be divisible by this number.
Start: These fields let you set the study start date and time. It must be in the Available Data range and before the Stop date/time.
Stop: These fields let you set the study stop date and time. It must be in the Available Data range and after the Start date/time.
By default, the Start/Stop Selection fields will be filled in with the Start and Stop values from the Available Data.
There are a variety of Report Options that you can specify:
Group by approach: When checked this will group all buttons that are in the same "approach" together and give approach totals along with other approach statistics. This is a common reporting method. If this is not checked then each button column is printed in the order that was specified in the button setup, with no approach statistics or grouping.
Total: When this is checked, you will have a "Total" row on each page of “shifted data” on the report. In other words you will have a total for each button type across the entire study period.
Table %: When checked this will show all data percentages.
Intersection %: When checked this will show percentages of the intersection data only.
Approach %: When checked this will show percentages.
Overall Approach %: When checked this will show percentages.
Peak Hour: When checked, the peak hour for the entire intersection is shown, and if "Group by approach" is checked each approach will also have it's own peak hour. Note: The interval must divide into 60 evenly or peak hours will not work. When calculating the peak hour, the peak hour will always fall on an increment of the interval, not necessarily on an even hour. For example, if you have 15 minute intervals, you could have a peak hour of 16:45 to 17:44.
Peak Hour Factor: When checked, the peak hour factor will show……
Subtotal every: This field can be set this to the number of intervals that you would like a subtotal for. So if you have 15 minute intervals and want hourly subtotals, set this to 4 (which means every 4 intervals show a subtotal).
Column Totals: If this is checked, you will have a "Total" column on each page of shifted data on the report. In other words you will have a total of all button counts for each time interval.
You can include additional data types (defined/named in Preferences) in the report, the default data type names are:
Pedestrians: When checked generates a report page for pedestrians (by grouping together all buttons set with a data type of “Pedestrians”).
Bicycles: When checked generates a report page for bicycles (by grouping together all buttons set with a data type of “Bicycles”).
Other: When checked generates a report page for other (by grouping together all buttons set with a data type of “Other”).
Print Intersection Summary: When checked, a summary page of the intersection will be generated.
Print Everything on one page: When checked the report generator will attempt to size the report so that everything shows up on a single page. If there are too many columns, subtotals and totals, it may not be successful.
Column Width: Use this field to set the width of the columns. The largest column name is shown here and you can adjust the width to be more narrow or wide so that the name fits. This is a rough display and may not always accurately reflect how the column text is displayed.
Columns to Print: This check list shows all columns (assigned buttons) available. All checked items in the list will be included in the report. Note! This list can grow rapidly when you start adding shifted keys. If you have buttons that were not used at all, so they shouldn’t be on the reports then you can make sure the button is set as unused in the button layout screen so it doesn’t clutter this list.
There are two buttons at the bottom of this screen:
Cancel: Cancels printing and returns to the "Unit Data” window.
Continue>>: When clicked, a “print preview” will be generated and displayed on the screen. From there you can choose to print by clicking on the print icon in the upper left corner of the window. Or you can click on the Close button to close the print preview without printing and returns you to the “Unit Data” window.
When you are in the “Unit Data” screen you can generate an export file from a list of standard exports by clicking on the “Export” button.
This will open a “Data Selection” screen:
This window is where you will choose what you want in your export. Here you can specify what columns you would like exported, you can adjust the start time, specify the length of each interval, choose which types export you want, and various other settings.
The upper left of this window shows the date/time range of the Available Data in this study. Normally you would expect it to be the same as or slightly wider than the actual study period.
The settings:
Adjust study start time by: You can adjust the start time forward or backward by entering a positive or negative number of minutes in this field. This allows for a slight adjustment to the start time. So if your watch doesn't agree with the unit's clock (which is the same as the PC's time that reset the unit) and you started a study at 3:04pm instead of at 3:00 you could enter a "-4" here to make the exports come out starting at 3:00 instead of 3:04.
Interval: This is how often (in minutes) buttons are summed up and displayed on the export as it's own row. For example, if the interval is 15, every 15 minutes there will be a button count listed on the export for each column. The default is 15 minutes.
Start: These fields let you set the study start date and time. It must be in the Available Data range and before the Stop date/time.
Stop: These fields let you set the study stop date and time. It must be in the Available Data range and after the Start date/time.
By default, the Start/Stop Selection fields will be filled in with the Start and Stop values from the Available Data.
Export Type: This is a pull-down list of the available export types.
CSV, Standard: In the standard CSV format all data fields are separated by commas with carriage returns at the end of each row. This is the recommended format to use.
CSV, Standard (Variation #1): In this variation there are less header fields and they are formatted slightly different. The standard format is recommended over this one since you have access to all header fields.
CSV, Timestamps: This format will actually export every button or code that was stored in the unit with the amount of time that has elapsed from the start of the study. This format can be useful for those who would like to process the data themselves with a custom program or for other general purpose timing calculations done by hand.
PDF: In this export, a PDF file is generated of a report (notice that when this is selected, the Report Options dialog pops up) see the reports above for descriptions of these options.
UTDF (TMC #, vol): This is a UTDF standard export. Notice that an Export Options dialog will pop up when this export is selected. These Export Options have you specify an Interval for this export which overrides the Interval specified above. It also has you specify a Synchro Node #. This is used when more than one counter is being used on the same intersection at the same time.
Split shifted data into separate files: If there are any buttons that were set as "shift" buttons then checking this will export shifted data into separate files. You will still only be prompted for one filename when exporting, the shift button name will be added to the filename with an underscore in between. For example if you export with a name of "myexport" and you have one shifted button (button A for instance) and you named it "Trucks" you would get two files: "myexport.csv" (containing the regular car data) and "myexport_Trucks.csv" (containing the Truck data). If you have no "shift" buttons, this setting does nothing at all.
Include totals: If this is checked, then there will be a "Total" column with all buttons pressed for each interval summed up.
Columns to Print: This check list shows all columns (assigned buttons) available. All checked items in the list will be included in the export. Note! This list can grow rapidly when you start adding shifted keys. If you have buttons that were not used at all, so they shouldn’t be in the exports then you can make sure the button is set as unused in the button layout screen so it doesn’t clutter this list.
There are two buttons at the bottom of this screen:
Cancel: Cancels the export and returns to the "Unit Data” window".
Continue>>: When clicked, a “Export data as….” dialog will pop up where you can select or specify the filename and location in standard Windows format. When this dialog is complete, you will be returned to the “Unit Data” window.
This section covers some of the more difficult options in more detail. These are used rarely, but when you need them you need to know what to do.
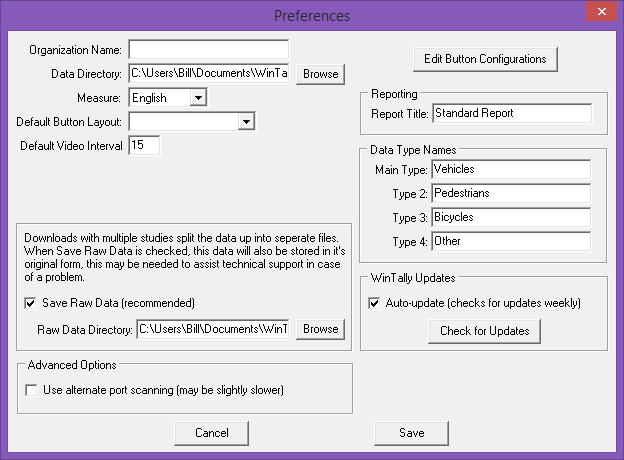
From the main screen you can click on the “Preferences” button and the following dialog will pop up:
This section will go into a detailed explanation of this screen.
Organization Name: Here you can enter in your company name or organization that you would like printed at the top of reports. You may leave this blank if you don't want your company name on reports.
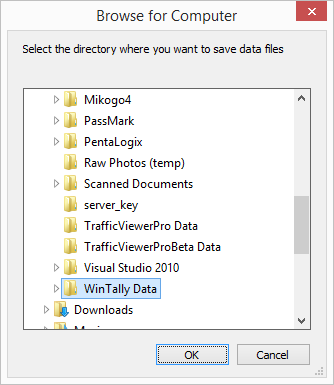
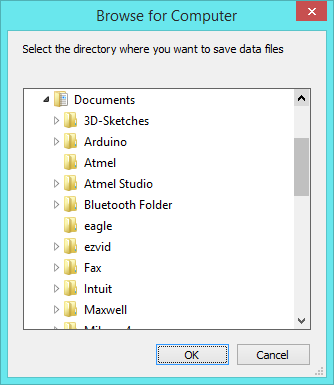
Data Directory: This is the directory (or folder if you prefer) that will open up by default when choosing to open a file or save a file. If you have a common directory where you save your count files, you may want to specify that here. If you click on the “Browse” button, a standard Windows file dialog will appear:
Measure: Currently this is only used for deciding the format of dates. It may be used for more at a later time. If "Metric" is selected the date format will be DD/MM/YYYY, if "English" is selected the date format will be MM/DD/YYYY.
Default Button Layout: This pull-down list will show all custom button layouts that you created and saved. You can choose on of those to be the new default button layout for all future downloads. If it is left blank, then the factory default layout will be used.
Default Video Interval: This field specifies the default interval to use if a “Video” (Video Interval) button is used in a button layout. If you don’t count from video this value will never be used.
Save Raw Data (recommended): If this is checked then any time you save data that has multiple studies in it, the data will be saved as one file in the "Raw Data Directory". This is in ADDITION to the files that get saved for each study. This is for troubleshooting only, these large files shouldn't be used for general use and will only be useful in case of a problem with files from multi-studies.
Raw Data Directory: This is only used if you have "Save Raw Data" checked. All data that downloaded that has multiple studies and is saved will also be saved as a single file with all studies in it to this directory. This directory is commonly a sub-directory of the normal data directory. If you click on the “Browse” button, you will be presented with a standard Windows file dialog which will allow you to choose the location for your raw data directory.
Use alternate port scanning (may be slightly slower): When checked, WinTally will attempt to open each com port that can possibly exist instead of using the Windows registry to determine available ports. This may be needed in some cases (possibly on Windows NT systems). You can try this if you are having problems detecting a unit to see if it makes a difference.
Edit Button Configurations: Pressing this button will open up a "Button Layouts" window where you can set-up how you commonly use the buttons, what names the buttons have, and set approach names. This will help to avoid extra work with common button configurations at each download.
This screen will be discussed in detail later in this manual.
Report Title: You can enter a description here which will be a heading on all reports generated. It could be your company name -- whatever you wish.
Data Type Names: Wintally can differentiate up to four data types, so there are four fields you may enter names for the types into: “Main Type:”, “Type 2:”, “Type 3:”, and “Type 4:”. These types are used in reports to generate additional report pages. All reports are one page (if too large, they may be cut into several pieces -- pages). Each type will generate its own page or report if enabled (see the report dialog).
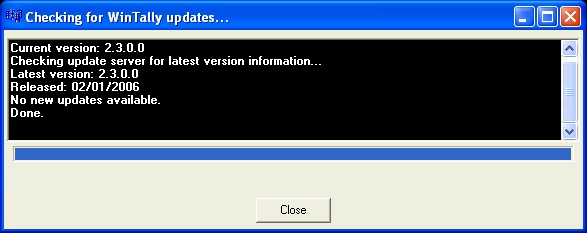
Auto-update (checks for updates weekly): If this is checked, then once a week (or longer if the software is not used), when the software is opened it will automatically check for updates on the internet, and upgrade WinTally if a new version is available.
Check for Updates: If this button is pressed, the software will check for any new WinTally updates on the internet and upgrade WinTally automatically if any are available. If you have an internet connection this is a very quick and convenient way to update WinTally to the latest version.
Cancel: This button cancels all changes made and returns to the "Main window".
Save: This button saves all changes made and returns to the "Main window".
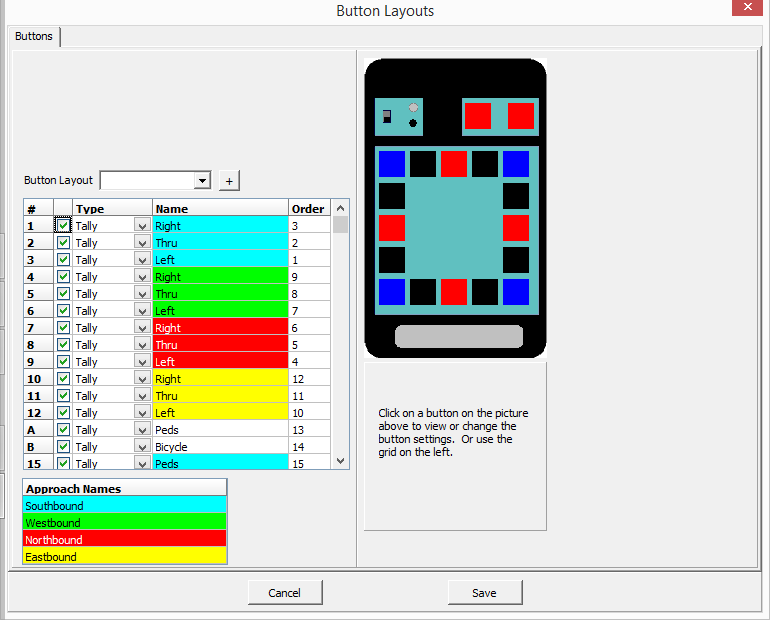
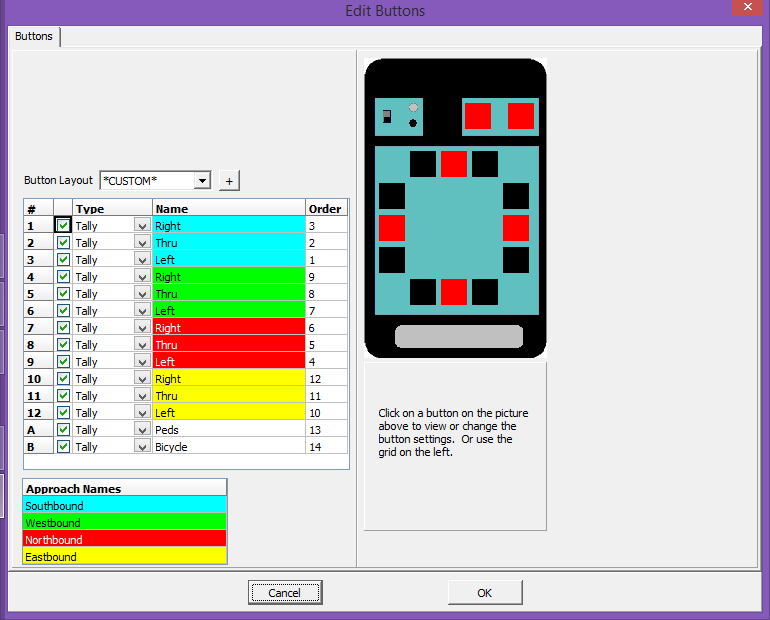
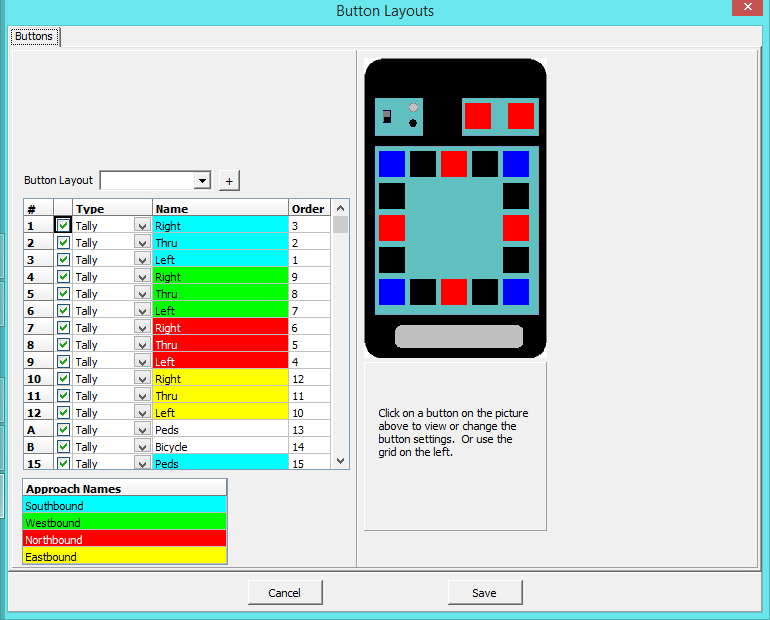
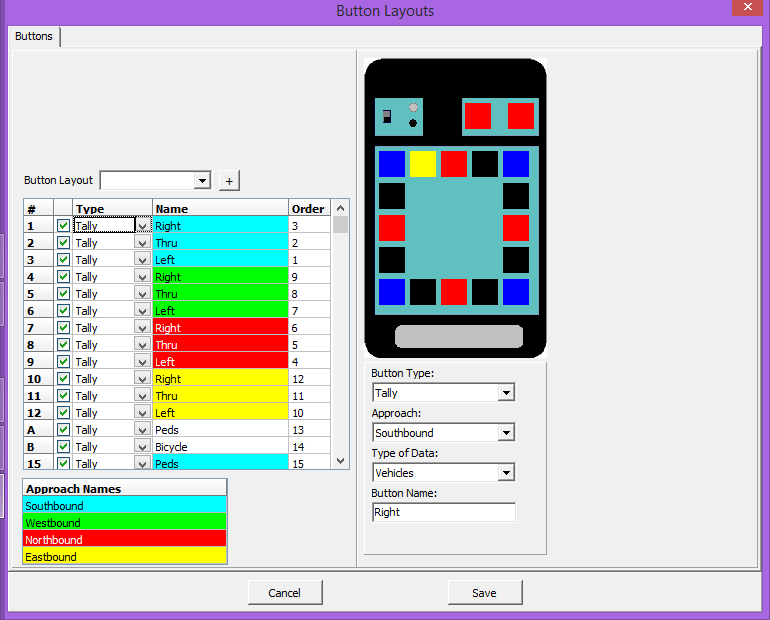
Here you can change the default names, types, and order of all buttons, along with assigning default Approach Names. In the upper left of the screen is a “Buttons” tab, this does nothing at this time, it is there for future use.
Button Layout: This pull-down list will contain all of your custom button layouts. If you select one of these, the tables below will change to reflect your layout. If this is blank, then the factory default layout is presented. Clicking on the “+” button give you a list of options: “Save”, “Save As New”, “Delete”, or “Rename”. These options will allow you to manage your custom button layouts.
Just below this field is the main configuration table which we describe below.
As an aid in knowing which button is which, when you move your mouse cursor in the table, one of the keys in the graphical representation of the MicroTally will be highlighted white corresponding to which row the mouse cursor is currently in. Also, if you click on any field in the table, or on any key in the MicroTally graphical representation; the corresponding key will be colored yellow and a set of fields will pop up directly below the graphical representation in which you can enter additional information for a button.
These additional fields are:
Button Type: This is a pull-down list of button type options: "Tally", "Undo Last Tally", "Shift", "Shift Lock", and “Video Interval”. This is the same list as fields in the third column of the table (see below). For more information on button types, see "Advanced Key Usage".
Approach: This is a pull-down list of the approaches from the “Approach Names” table. Here you assign which approach, if any, that the button is assigned to.
Type of Data: This is a pull-down list of the data types that are assigned in “Preferences” (see above). The factory default setting is Vehicles. This can be used to add another way to group buttons of similar data together on the reports. When printing you will see an option to group data types if you have a need for that.
Button Name: Here you can name your button (see the fourth column). Generally you will want to keep this very short (6 or so characters) for it to print neatly on "Group by Approach" type reports. "Approach Names" on the right automatically get stuck in front of the names that have the same background colors. Generally names such as "Left", "Right", "Thru", "Trucks", or "Peds" are normal names for buttons. A shifted button will always be identified by the "Shift" button somehow on other screens, exports, and reports; generally by inserting the "Shift" button name in front of the shifted button name.
Now we describe the table columns:
First column (#): This column lists the MicroTally button number for this entry. If you look at your MicroTally 14 overlay, you will see button numbers (1 thru 12 and A and B) next to each button. If the unit is a MicroTally 18, due to room issues, the numbers are not printed on the overlay, but they are in the same order and locations, with an additional four numbers (15 to 18).
Second column: This column allows you to enable and disable buttons. If you don't want to use a button (or shifted button), un-check the box in this column.
Third column (Type): This column allows you to change the type of the button (how it is used). If you select a cell in this column and then click on it again you will get a drop down list of options: "Tally", "Undo Last Tally", "Shift", "Shift Lock", and “Video Interval”. If an item is changed to Shift or Shift Lock you will notice the grid gets longer because you now have a whole set of "Shifted" buttons that you can name. Shifted buttons are tally only, their type cannot be changed. For more information on button types, see "Advanced Key Usage".
Fourth column (Name): In this column you can name your button. Generally you will want to keep this very short (6 or so characters) for it to print neatly on "Group by Approach" type reports. "Approach Names" on the right automatically get stuck in front of the names that have the same background colors. Generally names such as "Left", "Right", "Thru", "Trucks", or "Peds" are normal names for buttons. A shifted button will always be identified by the "Shift" button somehow on other screens, exports, and reports; generally by inserting the "Shift" button name in front of the shifted button name.
Fifth column (Order): This column will likely be removed in a future release for a more graphical or at least click-n-drag version. For now, you can re-order the way columns are printed or exported by changing the numbers in this column. The lowest number is printed/exported first (furthest left). If there are two numbers the same, the first one in the list will be printed first. These can all be set at 0, or left how they are if you do not care about the order. When printing by approach, however, all approaches will automatically get grouped together even if the numbers are not together.
Approach Names list: Below the table is a list of “Approach Names”. Enter in a name for each of the 4 approaches, one on each row. The background color shows which buttons belong to which approach. Approach names will be used to further identify each button name that has the same background color (in most cases the approach name is inserted in front of the button names that are in this approach). These can be left blank if you don't want to use them but you will not be able to print reports by approach. Some common approach names would be directions such as "Northbound" or "North".
The buttons at the bottom of the screen:
Cancel: Cancels all changes made and returns to the "Preferences window".
Save: Saves any changes made and returns to the "Preferences window".
The MicroTally supports up to 4 button “data types”. Basically the “type” is just a way to separate or group-together sets of buttons with selected “data types”. This can be used to create multiple page reports from one set of data. For most counting all buttons would normally be one “type” of button.
The default “types” in the MicroTally from the factory are: Vehicles, Pedestrians, Bicycles, and Other.
Often at intersection counts there are also pedestrians and bicycles that are kept track of while counting the vehicles. If all buttons were of the same type, then the buttons assigned to pedestrians or bicycles would only be able to be reported as part of the main report. However, if you flag the buttons used to count pedestrians as “Pedestrian type”, then at report time you have the option to generate a separate report page of pedestrian counts. Likewise, the same goes for bicycles, or any other “type” you might like to keep track of that is collected in the same study.
The default type names are just that. You can change the names to be anything that is more appropriate or understandable to you in “Preferences”.
In recent years video recording of intersections, or other traffic or pedestrian situations, has become more popular. The video is then played back and counted at a later time. This has added advantages over in-field counting in that it is more comfortable, you can always reverse the playback if there was confusion, and you can redo the count without a field visit.
The MicroTally is ideally suited when set up correctly, to register the counts from the video.
If the video is played back in real-time with no need to pause, the MicroTally can be used as is.
If the video is to be played back in faster than real-time (which is quite common), then the MicroTally needs to be able to stay synchronized with the video times even though they may be speeding up, stopping, reversing, etc. This is accomplished via the “Video Interval” concept.
This is based on the premise that most count study results (totals) are reported in intervals such as 15 minute intervals or 1 hour intervals.
To use this feature you need to choose a button that you will press every time the video reaches a chosen interval. To do this you will need to set a button as a “Video Interval” button in your button layout, often this would be the “A” or “B” button.
When you set a button as this type you will see a “Video Interval” field show up just above the button layout table where you can enter in a number of minutes. (Note: If setting a button as “Video Interval” through the “Preferences” screen you will not see that field show up, it is instead located on the main “Preferences” screen.)
If a study requires a report with 15 minute intervals you will want to set your Video Interval to 15 minutes or shorter. (Just be sure it divides evenly into the interval you want for your reports).
You will also see a “Video Start” field just above the “Video Interval” field. You will set that field to the start date/time for your video. The intervals will be added to this time each time the Video Interval button is pressed.
When you play your video at any speed you desire, recording the turning movements in the normal fashion until your reach the 15 minute point in the study (watching the video time). At this point you would press the button assigned to be Video Interval. You repeat this action every 15 minutes along the video track until the study is done. This technique ensures you stay synchronized to the video in 15 minute intervals so that your reports come out accurately.
There are a variety of reasons that can result in count results not being what you expected. This chapter will discuss a variety of causes of unexpected results and how to remedy them.
The most common problem here is that there was a large gap in the traffic and the Automatic Stop Timeout was reached which ended the study prematurely. Recycling the “Run/Stop” switch continued the study, but it is now two studies. You can use the “Merge” studies feature to correct this problem, and you can edit the timeout in the MicroTally for a longer timeout (factory default is 4 minutes) to prevent future occurrences.
The most common problem here is that the MicroTally was stored for several months to a year, then used for a study without resetting the MicroTally. After several months, the real-time clock in the MicroTally rolls over which would then cause a backwards timestamp error. The data is in the unit okay, but the timestamps are out of sequence. At the factory we can retrieve the file with some effort. Our latest firmware prevents the MicroTally from being used if it sits for several months without being reset, but older firmware can still suffer this problem.
if all your connections are good, the most likely problems are improperly installed or outdated USB to serial converter drivers, or Windows permission issues. If you are a current user and are having this issue when trying to install on a new computer, then try to update the USB to serial drivers with the manufacturer, or try another USB to serial converter. If you are in a larger company that has IS install your software, it could be a permissions issue. Likewise, if you are upgrading to Windows 8 or higher, you will need administrative rights (for single users this is not a problem). If you are a first time user, and the above advice does not seem to correct the problem, then see if you can find an older PC to install the software on to at least make sure all is working. If that works, then your problem has to be the serial drivers or permissions issues of some sort.
As mentioned above, the MicroTally only records what key has been pressed and when it was pressed, it is totally unaware of what the keypress will be used for. If your data summary or reports seem to be wrong, you need to go back and carefully review the key assignments. Particularly look for wrong key type assignments. The most common problem is finding a key assigned to “tally” when it was supposed to be “shift”. Key assignments are detailed in this manual.
The MicroTally timestamps can only go for about 8 months before the counters “roll over”. If you have not used the MicroTally for several months and you switch the MicroTally from “Stop” to “Run” and the unit is in a continuous rapid beep, that is an indicator to remind you to reset the unit before putting it out for a study. To do this, connect the unit to WinTally. When the communications status screen pops up, press the “Reset Unit” button. The rapid beeping will stop and you can now safely collect data with it.